CommandFusion iViewer
Scripting Documentation
Back to main index - Search:
Table of contents
iViewer Remote Monitor and JavaScript debugger
Since your GUI and JavaScript code are running on an embedded platform, debugging what happens on the device can be troublesome. iViewer comes with a powerful Remote Monitoring facility that allows you to see changes inside your GUI in realtime, as well as let you debug your JavaScript code.
The Remote Monitoring facility is basically a web server embedded in iViewer, to which you connect from a desktop platform on your local network. Currently, only WebKit-based web browsers are supported. The recommended browsers on both Windows and Mac are Apple Safari and Google Chrome. Safari may be the easiest one to use, as it supports automatically finding the iViewer instance on your network and can connect to it without requiring typing the device address in the address bar.
Setting up iViewer for Remote Monitoring
iViewer supports two different modes of operation: standalone, or remotely monitored. To configure remote monitoring, open the Settings application on your device and turn on the Enable switch in the Remote Debugging section of the settings.

You do not need to set a local port, unless you want to always use the same port on your device (i.e. make a bookmark on your web browser to a device that has a static IP address, always reusing the same port for debugging). If you choose to configure a local port, make sure that the port is not already used by one of your GUI's remote systems.
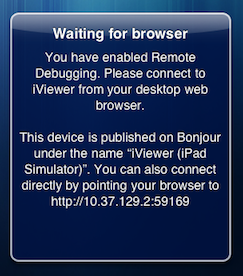
When your GUI is up and running, iViewer makes use of Bonjour to advertise the Remote Monitoring facility over the network. Once iViewer is started and Remote Monitoring is enabled, you will see this alert on your device screen, with iViewer waiting for a Remote Monitor connection. At this stage, the GUI is loaded and ready to run but will not start (including connecting to remote systems) until a Remote Monitor is connected.
Setting up Safari
Apple's Safari has the ability to find web servers on your local network, as long as they advertise themselves on Bonjour (which iViewer does).
Setting up Safari on Windows
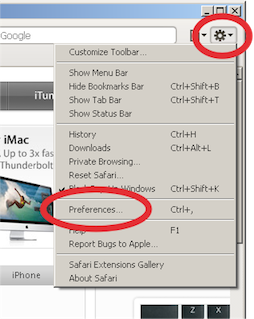
On Windows, select the Settings gears at right of the Safari Window, and click the Preferences... menu label
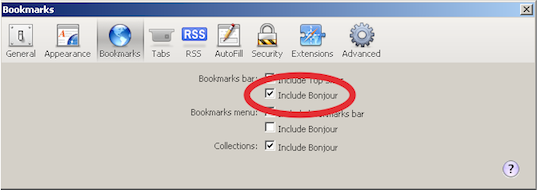
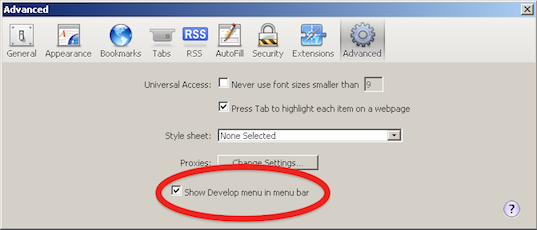
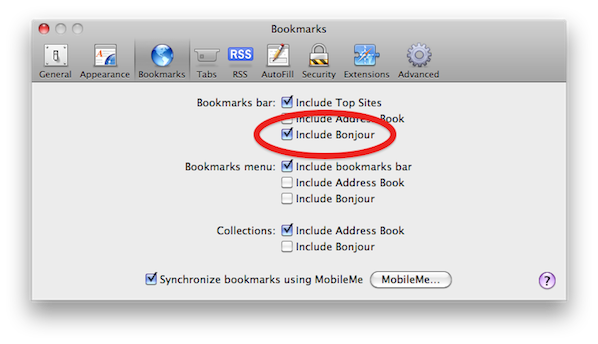
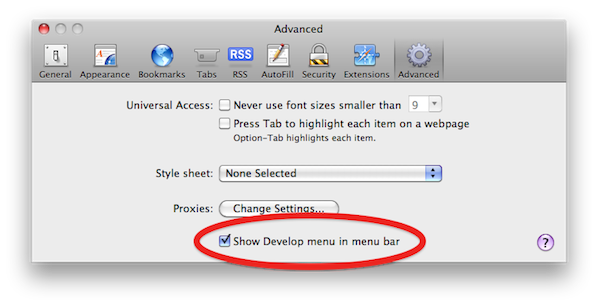
Then in the Preferences window, select the Bookmarks tab and check the Include Bonjour checkbox in the Bookmarks Bar group. Also, to enable JavaScript debugging, go to the Advanced tab and check the Show Develop menu in menu bar checkbox.
Setting up Safari on Mac
On Mac OS X, open the Safari Preferences, go to the Bookmarks tab and check the Include Bonjour checkbox in the Bookmarks Bar group. Also, to enable JavaScript debugging, go to the Advanced tab and check the Show Develop menu in menu bar checkbox.
Connecting to the Remote Debugging Monitor
Connecting to the monitor is as easy as firing up Safari on Windows or Mac, and using its Bonjour menu item to find the running iViewer. Alternately, you can follow the instructions of the alert box displayed on your device, typing the URL it displays to connect to iViewer.
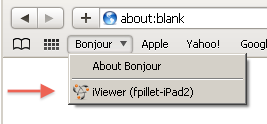
Once connected, the Remote Debugging Monitor connects and your GUI starts up. Your browser window shows the Remote Monitor user interface, landing on the Script Log tab.
Remote Debugging Monitor user interface
The monitor's user interface shows five main panels of information:
- Script Log: log messages issued by your JavaScript code via
CF.log() - Mixed Log: dual log mixing messages reported by iViewer itself, and your own log messages as well
- Project: general project information (in this release, Cache information only)
- Systems: remote systems your GUI connects to, with full realtime status information
- Joins: state of all the joins defined in your GUI, updated in real time
Each panel is updated in real time, whether it's open or not. This is tremendously useful when running your GUI on the device, as you can see join changes in real time, for example when you press a button or in response to external input.
Script Log and Mixed Log
The Script Log panel shows your own log entries, those output by your script using the CF.log() call (as well as a couple entries at startup which indicate the version of iViewer you are running). Every time you issue a CF.log() call, this will generate a text line in both the Script Log and Mixed Log panels.
The Mixed Log shows your own log entries, but also messages reported by iViewer itself. For example, when a join changes, a line is written to the Mixed Log with the new value of the join. Similarly, acquiring or losing the connection to a remote system, matching feedback are events that appear in the Mixed Log. In some cases, you will also see errors in your GUI, like for example math expression evaluation errors. If you have an error in a math expression, a message will typically appear in the Mixed Log.
Project Information
The Project panel shows information about cached data in iViewer. Image and Sound cache status is displayed, and you can see in real time (as elements download) the caches filling. Every successfully downloaded image or sound will have a green checkmark, whereas failures will show a red cross.
Using the Project tab, you can quickly make sure that all assets defined in your GUI have been downloaded to the device, and that none is missing on the server side.
Remote Systems
The Systems panel shows all the remote systems iViewer connects to, as well as local loopback systems. Each system has its own panel, and its information is updated in real time, including bytes received, bytes sent and number of feedback matches. You can take advantage of this information to verify that data is effectively being transmitted to and from remote systems.
Joins
The Joins panel shows all the joins defined in your GUI, along with their current value and a quick summary of the tokens defined for each join. Since iViewer automatically adds a [join] token for every join, it will always appear here.
The latest join that changed has its value on green background. As you interact with the GUI or joins are being modified by external systems, you'll see the last modified join change (green background moving from join to join), so at a quick glance you can immediately see what was the last modified join, and its current value.
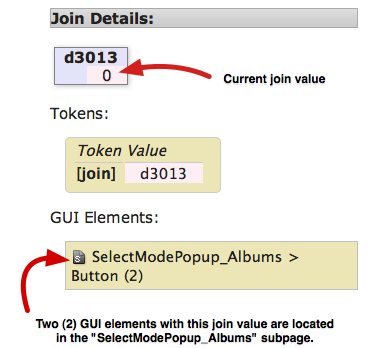
When you click a join, its details are displayed on the right panel. You can see the join ID, current value, list of tokens, as well as a summary of all the places in the GUI where GUI elements carry this join value. Each entry in the list carries a small icon, indicating whether the GUI element is in a landscape page, portrait page or in a subpage.
Debugging JavaScript
One of the biggest challenges with embedded development is being able to debug code that runs on devices. The Remote Debugging Monitor brings you an effective solution to this problem, right in your web browser.
Apple Safari and Google Chrome both embed debugging tools for HTML and JavaScript. With these tools, you can set breakpoints, catch exceptions, inspect object contents, test little bits of JavaScript code and even interact with iViewer directly from the JavaScript console.
Once connected to iViewer using the Remote Debugging Monitor, you can bring up several tools that will make your life easier. Among the many tools that these browser offer, the ones relevant to debugging your JavaScript code are:
- the Resources panel that shows the loaded scripts and syntax errors
- the Script panel, for inspecting a script, placing breakpoints and stepping through the code
- the Console panel, with a live interactive console that allows you to inspect objects, evaluate (try) expressions and even call into the iViewer API.
Accessing the debugging tools on Windows
First, make sure the Remote Debugging Monitor window in Safari is frontmost. The debugging tools will appear in the frontmost window, and you want them to be tied to the Remote Debugging Monitor window.
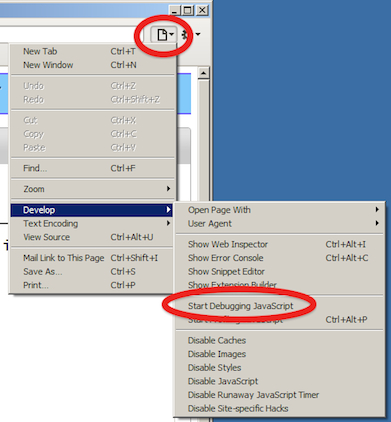
In the Safari document menu (at right of the address bar), click the Develop menu (you'll need to have set up Safari to enable Develop menu first). There, you can access the various tools you need to perform your tasks.
Accessing the debugging tools on Mac
First, make sure the Remote Debugging Monitor window in Safari is frontmost. The debugging tools will appear in the frontmost window, and you want them to be tied to the Remote Debugging Monitor window.
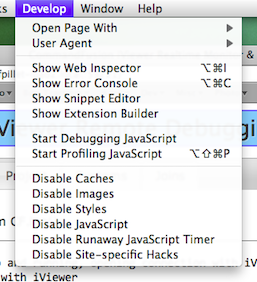
In the Safari menu bar, click the Develop menu (you'll need to have set up Safari to enable Develop menu first). There, you can access the various tools you need to perform your tasks.
Common tasks on both Mac and Windows
Click the Start debugging JavaScript item to enable JavaScript debugging. Safari will offer to leave JavaScript debugging enabled all the time. It is a good idea to do this if you're using the debugging tools often (but it will make Safari a bit slower in the general case).
From this point on, the window is split in two. The bottom part shows a multiple-panel area where you will perform your debugging tasks. You can resize this area as needed. The screenshot below shows an overview of the debugging area layout:
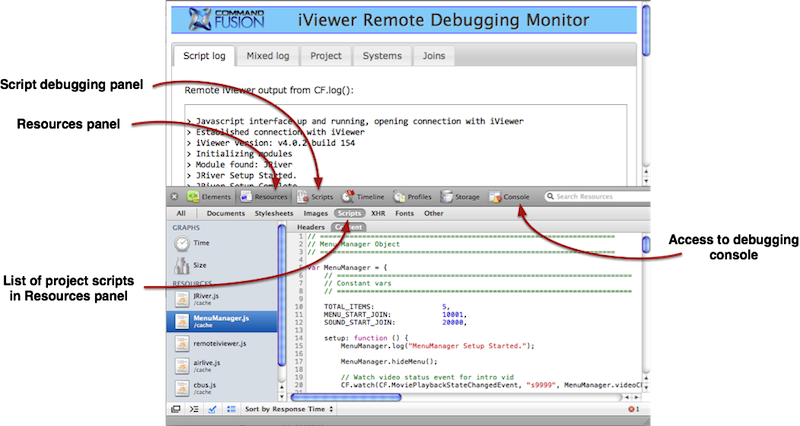
The Resources panel lists all the resources for the Remote Debugging Monitor. When it is selected, there is a sub-header bar from which you can select to see only the Scripts. There will always be a remoteiviewer.js script, this is iViewer's own interface to the application. The other scripts are your own project's. Click on a script name in the left list to see its contents. If there are syntax errors in your script, the name will be followed by a red badge indicating the number of errors.
Locating syntax errors
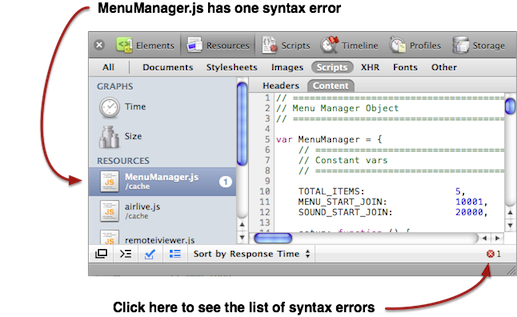
When there are syntax errors in your JavaScript, you'll see a red badge with the number of errors next to each of your JavaScript files that has errors. There is also a button bottom-right of the window which shows the total number of errors. Click this button to bring up the error console that shows the list of syntax errors.
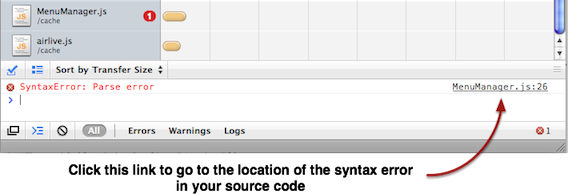
You can now click on the link for each of the errors: it will directly show the error in the code.
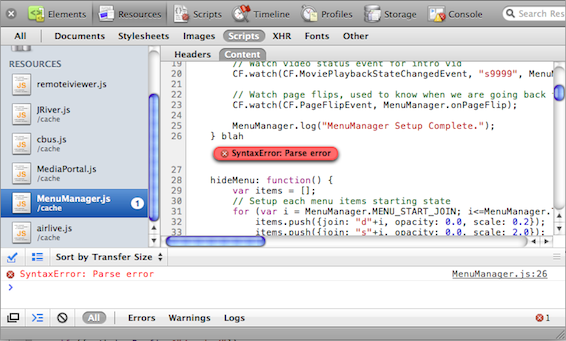
Fix your errors, then restart iViewer and reconnect the debugging monitor to continue.
Setting breakpoints in your JavaScript
The debugger allows you to set breakpoints in your code. When execution reaches the breakpoint, the debugger will pause execution and jump directly at the breakpoint location. There you can step trace through your code and examine your variables. This is an essential tool for JavaScript debugging. Learning to use the debugger is key to mastering JavaScript development, as you will be able to find errors more quickly than when using simple logging with CF.log().
You can set breakpoints from any panel that shows JavaScript source code. To set a breakpoint, click the line number on the left, where you want execution to stop. An arrow will appear here. You can set as many breakpoints as you want in your code.
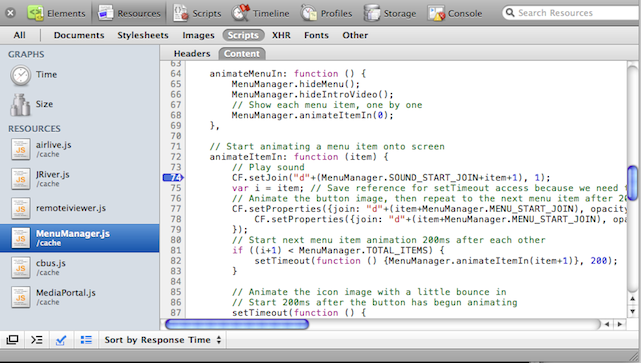
Stepping through code
Once execution reaches a breakpoint, you are in single-stepping mode. The source code window shows where the execution point is. The right pane shows the call stack, local and global variables, and other breakpoints. When execution reaches the breakpoint, Safari tends to not show you the breakpoint line right away. One trick you can use is click in some function listed in the Call Stack area, then click to the first listed function. This will bring the view back to where the execution point actually is.
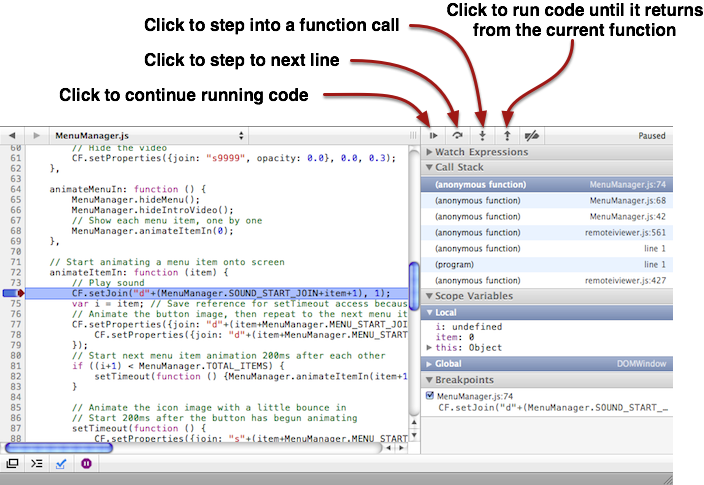
The various controls you can use are highlighted in the screenshot above. The debugger has many other nice features. For example, drag the mouse and pause over a variable in the source code to directly see its contents. This works with variables, objects, and even functions!
Additional debugger features
- Expand objects using the left triangle in the local variable lists to see their contents.
- Double-click a variable's value to change its value.
- The call stack shows the full call stack for your code, go up the stack clicking on each function to display the local variable for each of the functions.
- Press ESC or click the console button at bottom to bring up the interactive console
Interactive console
Press the ESC key to bring up the console at bottom of the screen, where you can type JavaScript expressions (for example, type the name of a variable to see its contents). The console can be very useful because when you type a variable name, it will show its contents at the time it was displayed. You can keep a log of various values for the same variable or object here, to remember what it went through.
The interactive console also allows you to evaluate (execute) JavaScript code. This can be short expressions, but you can also modify runtime objects, and even define new functions there! You can also call iViewer functions directly from the interactive console. You can call CF.log() directly, but also call any other iViewer function. The interactive console works even when JavaScript is not paused. To make any call into iViewer, you'll have to do this when JavaScript is running (not paused).
For example, the interactive console lets you change join values while your GUI runs. Triggering a join is as easy as typing CF.setJoin("d0", 1); in console! You can also call functions that return information, as long as you provide callback code for this.
